Real Dashboards: Adding a Reset Button
Finally, let’s add a reset button to our dashboard that allows users to clear the current molecule,
header information, and histogram from the dashboard and return to the initial state. This will make
it easier for users to start fresh without having to manually clear the input field or refresh the page.
To do this, we will add a new button to our layout (to the right of the Load Structure button) and
then update our callback function to handle the reset functionality.
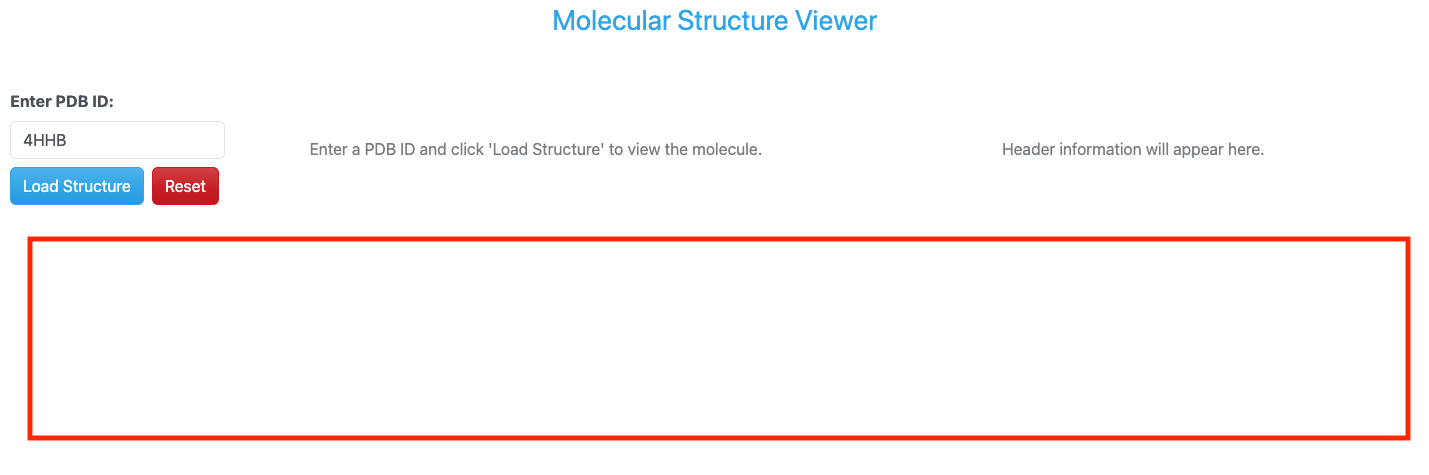
PDB dashboard layout with reset button.
Updated Imports
To implement the reset functionality, we will need to import the ctx object from Dash which allows
us to determine which input triggered the callback. This will help us differentiate between the load
button and the reset button. Let’s update our imports in the app.py file.
from dash import Dash, Input, Output, State, callback, ctx, dcc, html
Updated Layout
Next, we will update our layout to include a new reset button. We will use another dbc.Button component for this reset button and place it to the right of the existing load button. To line it up nicely, we will wrap both buttons in a dbc.Row component and each button in its own column using dbc.Col components.
dbc.Row([
    dbc.Col(dbc.Button("Load Structure", id='load-button', color="primary"), width="auto"),
    dbc.Col(dbc.Button("Reset", id='reset-button', color="danger"), width="auto"),
], className="g-2"),
Updated Callback Function
The first thing we need to do is add an additional input to our callback function for the reset button. This will allow us to trigger the same callback function when the reset button is clicked.
@callback(
    [Output('molecule-viewer', 'children'),
    Output('header-info', 'children'),
    Output('amino-acid-histogram', 'figure'),
    Output('amino-acid-histogram', 'style'),
    Output('status-message', 'children')],
    Input('load-button', 'n_clicks'),
    Input('reset-button', 'n_clicks'),
    State('pdb-input', 'value'),
    prevent_initial_call=True
)
Since we now have two buttons that can trigger the same callback function, we will need to update our callback
function, load_molecule, to determine which button was clicked and handle the logic accordingly. We will use
the ctx object to check which input triggered the callback. If the reset button was clicked, we will return the
initial state of the dashboard with empty molecule viewer, header information, and histogram. If the load button
was clicked, we will proceed with loading the molecule as before.
def load_molecule(load_clicks, reset_clicks, pdb_id):

    if not pdb_id:
        return (
            html.Div("Please enter a valid PDB ID.", className="text-center text-muted mt-5"),
            html.Div("Header information will appear here.", className="text-center text-muted mt-5"),
            {},
            {'display': 'none'},
            dbc.Alert("Please enter a PDB ID.", color="warning")
        )

    if ctx.triggered_id == 'reset-button':
        return (
            html.Div("Enter a PDB ID and click 'Load Structure' to view the molecule.", className="text-center text-muted mt-5"),
            html.Div("Header information will appear here.", className="text-center text-muted mt-5"),
            {},
            {'display': 'none'},
            None
        )
Running the Updated App
Once again, putting all of these updates together, our updated app.py file should look like this:
Code
  1import os
  2from collections import Counter
  3
  4import dash_bio as dashbio
  5import dash_bootstrap_components as dbc
  6import plotly.express as px
  7from Bio.PDB import PDBList, PDBParser, parse_pdb_header
  8from dash import Dash, Input, Output, State, callback, ctx, dcc, html
  9from dash_bio.utils import PdbParser as DashPdbParser
 10from dash_bio.utils import create_mol3d_style
 11
 12# Initialize the Dash app
 13external_stylesheets = [dbc.themes.CERULEAN]
 14app = Dash(__name__, external_stylesheets=external_stylesheets)
 15
 16# App layout
 17app.layout = dbc.Container([
 18    dbc.Row([
 19        html.Div("Molecular Structure Viewer", className="text-primary text-center fs-3 mb-4")
 20    ]),
 21
 22    dbc.Row([
 23        dbc.Col([
 24            dbc.Label("Enter PDB ID:", className="fw-bold"),
 25            dbc.Input(
 26                id='pdb-input',
 27                type='text',
 28                placeholder='e.g., 4HHB, 3AID, 2MRU, 4K8X',
 29                value='4HHB',
 30                className="mb-2"
 31            ),
 32            dbc.Row([
 33                dbc.Col(dbc.Button("Load Structure", id='load-button', color="primary"), width="auto"),
 34                dbc.Col(dbc.Button("Reset", id='reset-button', color="danger"), width="auto"),
 35            ], className="g-2"),
 36            html.Div(id='status-message', className="mt-3")
 37        ], width=2),
 38
 39        dbc.Col([
 40            html.Div(id='molecule-viewer', children=[
 41                html.Div("Enter a PDB ID and click 'Load Structure' to view the molecule.",
 42                        className="text-center text-muted mt-5")
 43            ])
 44        ], width=5),
 45
 46        dbc.Col([
 47            html.Div(id='header-info', children=[
 48                html.Div("Header information will appear here.",
 49                        className="text-center text-muted mt-5")
 50            ], style={'maxHeight': '600px', 'overflowY': 'auto'})
 51        ], width=5)
 52    ], className="mt-4"),
 53
 54    dbc.Row([
 55        dbc.Col([
 56            dcc.Graph(id='amino-acid-histogram', figure={}, style={'display': 'none'})
 57        ], width=12)
 58    ], className="mt-4"),
 59], fluid=True)
 60
 61# Callback to load and display molecule
 62@callback(
 63    [Output('molecule-viewer', 'children'),
 64    Output('header-info', 'children'),
 65    Output('amino-acid-histogram', 'figure'),
 66    Output('amino-acid-histogram', 'style'),
 67    Output('status-message', 'children')],
 68    Input('load-button', 'n_clicks'),
 69    Input('reset-button', 'n_clicks'),
 70    State('pdb-input', 'value'),
 71    prevent_initial_call=True
 72)
 73def load_molecule(load_clicks, reset_clicks, pdb_id):
 74
 75    if not pdb_id:
 76        return (
 77            html.Div("Please enter a valid PDB ID.", className="text-center text-muted mt-5"),
 78            html.Div("Header information will appear here.", className="text-center text-muted mt-5"),
 79            {},
 80            {'display': 'none'},
 81            dbc.Alert("Please enter a PDB ID.", color="warning")
 82        )
 83
 84    if ctx.triggered_id == 'reset-button':
 85        return (
 86            html.Div("Enter a PDB ID and click 'Load Structure' to view the molecule.", className="text-center text-muted mt-5"),
 87            html.Div("Header information will appear here.", className="text-center text-muted mt-5"),
 88            {},
 89            {'display': 'none'},
 90            None
 91        )
 92
 93    try:
 94        # Clean up PDB ID (remove whitespace, convert to lowercase)
 95        pdb_id = pdb_id.strip().lower()
 96
 97        # Create PDB directory if it doesn't exist
 98        pdb_dir = './pdb_files'
 99        os.makedirs(pdb_dir, exist_ok=True)
100
101        # Download PDB file using BioPython
102        pdbl = PDBList()
103        pdb_file = pdbl.retrieve_pdb_file(pdb_id, pdir=pdb_dir, file_format='pdb')
104
105        # Read PDB file content for visualization
106        dash_parser = DashPdbParser(pdb_file)
107        pdb_data = dash_parser.mol3d_data()  # Get data in format suitable for Molecule3dViewer
108        # create styles for visualization needed by Molecule3dViewer
109        # atoms is a list of dictionaries obtained from parsing the PDB file with DashPdbParser
110        # visualization_type can be 'cartoon', 'stick', 'sphere'
111        # color_element can be 'residue', 'chain', 'element', 'partialCharge'
112        styles = create_mol3d_style(
113            pdb_data['atoms'], visualization_type='cartoon', color_element='residue'
114        )
115
116        # Parse PDB structure for amino acid analysis
117        bio_parser = PDBParser(QUIET=True)
118        structure = bio_parser.get_structure(pdb_id, pdb_file)
119        amino_acid_counts = count_amino_acids(structure)
120
121        # Parse PDB header information
122        header_info = parse_pdb_header(pdb_file)
123
124        # Create Molecule3dViewer component
125        viewer = create_molecule_viewer(pdb_data, styles)
126
127        # Create header display
128        header_display = create_header_display(header_info, pdb_id)
129
130        # Create amino acid histogram
131        histogram = create_amino_acid_histogram(amino_acid_counts, pdb_id)
132
133        status = dbc.Alert(
134            f"Successfully loaded PDB ID: {pdb_id.upper()}",
135            color="success"
136        )
137
138        if not histogram:
139            return viewer, header_display, histogram, {'display': 'none'}, status
140        else:
141            return viewer, header_display, histogram, {'display': 'block'}, status
142
143    except Exception as e:
144        error_msg = dbc.Alert(
145            f"Error loading PDB {pdb_id.upper()}: {str(e)}",
146            color="danger"
147        )
148        empty_viewer = html.Div(
149            "Failed to load molecule. Please check the PDB ID and try again.",
150            className="text-center text-muted mt-5"
151        )
152        empty_header = html.Div(
153            "Header information will appear here.",
154            className="text-center text-muted mt-5"
155        )
156        return empty_viewer, empty_header, {}, {'display': 'none'}, error_msg
157
158def create_molecule_viewer(pdb_data, styles):
159    """Create a Molecule3dViewer from PDB data"""
160    return dashbio.Molecule3dViewer(
161        id='molecule-3d',
162        modelData=pdb_data,
163        styles=styles,
164        selectionType='atom',
165        backgroundColor='#F0F0F0',
166        height=600,
167        width='100%'
168    )
169
170def create_header_display(header_info, pdb_id):
171    """Create a formatted display of PDB header information"""
172    header_sections = []
173
174    # Title
175    if 'name' in header_info:
176        header_sections.append(
177            html.Div([
178                html.H6("Name", className="fw-bold mt-3 mb-2"),
179                html.P(header_info['name'], className="text-sm")
180            ])
181        )
182
183    # Structure Classification
184    if 'structure_method' in header_info:
185        header_sections.append(
186            html.Div([
187                html.H6("Method", className="fw-bold mt-3 mb-2"),
188                html.P(header_info['structure_method'], className="text-sm")
189            ])
190        )
191
192    # Release Date
193    if 'release_date' in header_info:
194        header_sections.append(
195            html.Div([
196                html.H6("Release Date", className="fw-bold mt-3 mb-2"),
197                html.P(header_info['release_date'], className="text-sm")
198            ])
199        )
200
201    # Deposition Date
202    if 'deposition_date' in header_info:
203        header_sections.append(
204            html.Div([
205                html.H6("Deposition Date", className="fw-bold mt-3 mb-2"),
206                html.P(header_info['deposition_date'], className="text-sm")
207            ])
208        )
209
210    # Resolution
211    if 'resolution' in header_info and header_info['resolution'] is not None:
212        header_sections.append(
213            html.Div([
214                html.H6("Resolution (Å)", className="fw-bold mt-3 mb-2"),
215                html.P(f"{header_info['resolution']:.2f}", className="text-sm")
216            ])
217        )
218
219    if 'journal_reference' in header_info and header_info['journal_reference']:
220        journal_text = header_info['journal_reference']
221        header_sections.append(
222            html.Div([
223                html.H6("Journal Reference", className="fw-bold mt-3 mb-2"),
224                html.P(journal_text, className="text-sm", style={'wordWrap': 'break-word'})
225            ])
226        )
227
228    # Keywords
229    if 'keywords' in header_info and header_info['keywords']:
230        keywords_text = header_info['keywords']
231        header_sections.append(
232            html.Div([
233                html.H6("Keywords", className="fw-bold mt-3 mb-2"),
234                html.P(keywords_text, className="text-sm", style={'wordWrap': 'break-word'})
235            ])
236        )
237
238    if header_sections:
239        return dbc.Card([
240            dbc.CardBody([
241                html.H5(f"PDB: {pdb_id.upper()}", className="card-title"),
242                html.Hr(),
243                *header_sections
244            ])
245        ], style={'height': '100%'})
246    else:
247        return html.Div("No header information available.", className="text-center text-muted mt-5")
248
249def count_amino_acids(structure):
250    """Count amino acid frequencies in a PDB structure"""
251    # Standard amino acids (3-letter codes)
252    standard_aa = {
253        'ALA', 'CYS', 'ASP', 'GLU', 'PHE', 'GLY', 'HIS', 'ILE', 'LYS', 'LEU',
254        'MET', 'ASN', 'PRO', 'GLN', 'ARG', 'SER', 'THR', 'VAL', 'TRP', 'TYR'
255    }
256
257    amino_acids = []
258
259    # Iterate through all residues in all chains
260    for model in structure:
261        for chain in model:
262            for residue in chain:
263                # Get residue name and check if it's a standard amino acid
264                res_name = residue.get_resname().strip()
265                if res_name in standard_aa:
266                    amino_acids.append(res_name)
267
268    # Count frequencies
269    return Counter(amino_acids)
270
271def create_amino_acid_histogram(amino_acid_counts, pdb_id):
272    """Create a Plotly histogram of amino acid frequencies"""
273    if not amino_acid_counts:
274        return {}
275
276    # Convert to lists for plotting
277    amino_acids = list(amino_acid_counts.keys())
278    counts = list(amino_acid_counts.values())
279
280    # Create bar chart (histogram)
281    fig = px.bar(
282        x=amino_acids,
283        y=counts,
284        labels={'x': 'Amino Acid', 'y': 'Frequency'},
285        title=f'Amino Acid Composition - PDB: {pdb_id.upper()}',
286        color=counts,
287        color_continuous_scale='Viridis'
288    )
289
290    # Update layout
291    fig.update_layout(
292        xaxis_title='Amino Acid (3-letter code)',
293        yaxis_title='Count',
294        showlegend=False,
295        height=400,
296        hovermode='x'
297    )
298
299    # Sort by amino acid name for consistent display
300    fig.update_xaxes(categoryorder='category ascending')
301
302    return fig
303
304# Run the app
305if __name__ == "__main__":
306    app.run(host='0.0.0.0', port=8050, debug=True)
Again, to run the updated app, simply execute the following command in your VS Code terminal (if it’s not already running):
(.venv) [mbs337-vm]$ python app.py
Dash is running on http://0.0.0.0:8050/

* Serving Flask app 'app'
* Debug mode: on
Now we can navigate to http://<IP_ADDRESS>:8050/ in our web browser to see the updated PDB dashboard
with the new reset button.
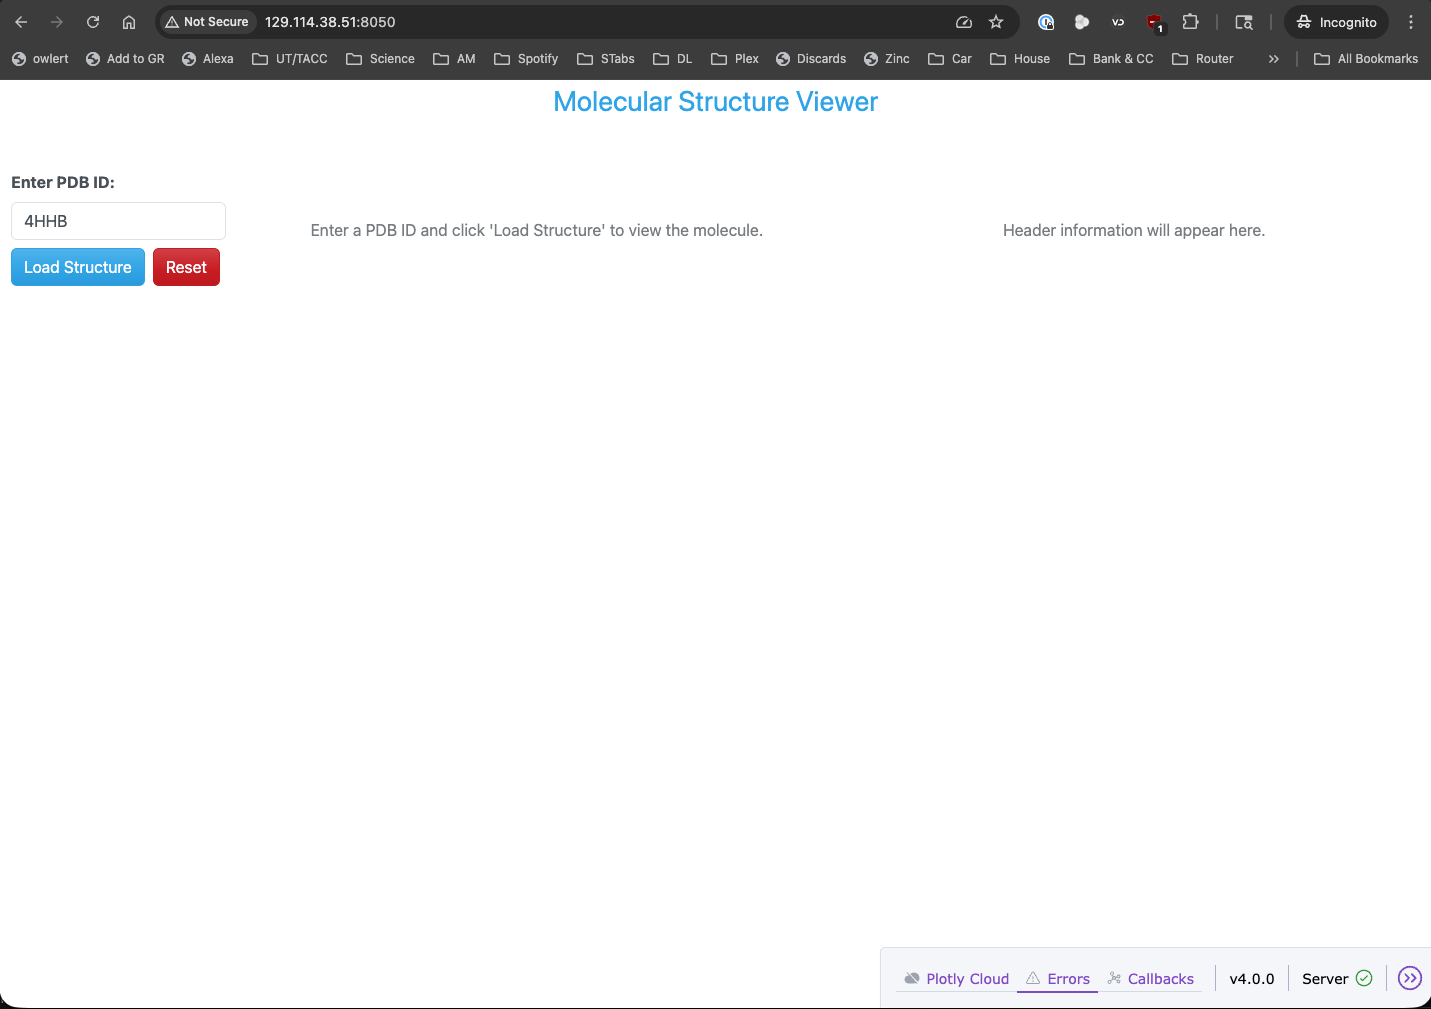
PDB dashboard application with reset button running in a web browser.