Real Dashboards: Adding a Component to Display a Histogram of Amino Acid Frequencies
Let’s add one more feature to our PDB dashboard to make it even more informative. We will add a component that displays a histogram of the amino acid frequencies in the loaded PDB structure. This will give users a quick visual overview of the composition of the molecule they are viewing. To do this, we will use Dash’s dcc.Graph component and have it contain a histogram created by Plotly Express based on the amino acid frequencies calculated from the PDB file. This will lead us to adding another row to our layout below the molecule viewer and header information columns.
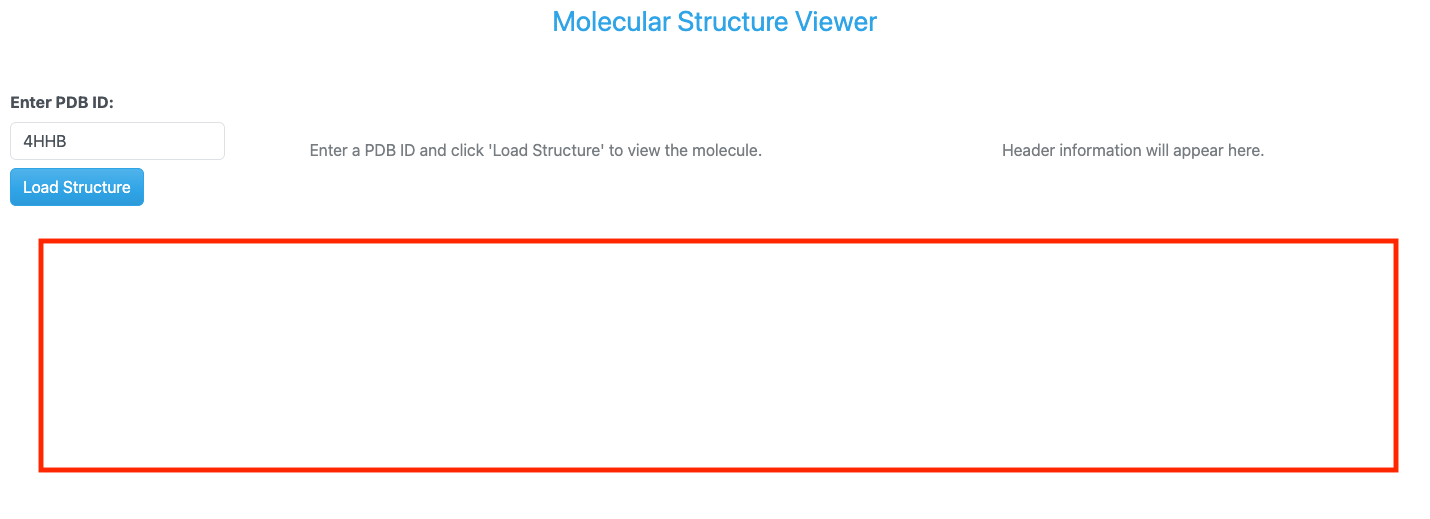
PDB dashboard layout with added row for amino acid frequency histogram.
Updated Imports
To implement this feature, we will need to import some additional components from Dash, BioPython, and
Plotly Express. Specifically, we will need to import the dcc module from Dash to use the Graph component,
the PDBParser class from Biopython to parse the PDB file, and the plotly.express module to create the histogram.
Let’s update our imports in the app.py file.
from collections import Counter

import plotly.express as px
from Bio.PDB import PDBList, PDBParser, parse_pdb_header
from dash import Dash, Input, Output, State, callback, dcc, html
Updated Layout
Next, we will update our layout to include a new row for the amino acid frequency histogram. We will use a dbc.Row component to create this new row which will contain a dbc.Col component that will hold the dcc.Graph component for the histogram. This new column will span the full width of the layout (width=12).
dbc.Row([
    dbc.Col([
        dcc.Graph(id='amino-acid-histogram', figure={}, style={'display': 'none'})
    ], width=12)
], className="mt-4"),
Updated Callback Function
Again, since we want to update the content of the new histogram component when the user loads a new PDB structure, we will need to update our callback function to include an additional two outputs for the histogram figure.
@callback(
    [Output('molecule-viewer', 'children'),
    Output('header-info', 'children'),
    Output('amino-acid-histogram', 'figure'),
    Output('amino-acid-histogram', 'style'),
    Output('status-message', 'children')],
    Input('load-button', 'n_clicks'),
    State('pdb-input', 'value'),
    prevent_initial_call=True
)
As you saw in the layout section, we will target the id amino-acid-histogram to update both the content and style of the histogram component.
Once again we need to update the logic of our callback function, load_molecule, to calculate the
amino acid frequencies from the PDB file and create a histogram figure using Plotly Express. We will
add the following code to our callback function to calculate the amino acid frequencies:
# Parse PDB structure for amino acid analysis
bio_parser = PDBParser(QUIET=True)
structure = bio_parser.get_structure(pdb_id, pdb_file)
amino_acid_counts = count_amino_acids(structure)
As you can see, we will use Biopython’s PDBParser to parse the PDB file and then to get the structure. Then we will call a helper function called count_amino_acids that will take the parsed structure and return a collections.Counter object (dictionary) with the counts of each amino acid in the structure. The count_amino_acids function will look something like this:
def count_amino_acids(structure):
    """Count amino acid frequencies in a PDB structure"""
    # Standard amino acids (3-letter codes)
    standard_aa = {
        'ALA', 'CYS', 'ASP', 'GLU', 'PHE', 'GLY', 'HIS', 'ILE', 'LYS', 'LEU',
        'MET', 'ASN', 'PRO', 'GLN', 'ARG', 'SER', 'THR', 'VAL', 'TRP', 'TYR'
    }

    amino_acids = []

    # Iterate through all residues in all chains
    for model in structure:
        for chain in model:
            for residue in chain:
                # Get residue name and check if it's a standard amino acid
                res_name = residue.get_resname().strip()
                if res_name in standard_aa:
                    amino_acids.append(res_name)

    # Count frequencies
    return Counter(amino_acids)
Then, we will create a histogram figure using Plotly Express based on the amino acid counts. We have created a helper function called create_amino_acid_histogram that takes the amino acid counts and the PDB ID as input and returns a Plotly figure object.
# Create amino acid histogram
histogram = create_amino_acid_histogram(amino_acid_counts, pdb_id)
The create_amino_acid_histogram function will look something like this:
def create_amino_acid_histogram(amino_acid_counts, pdb_id):
    """Create a Plotly histogram of amino acid frequencies"""
    if not amino_acid_counts:
        return {}

    # Convert to lists for plotting
    amino_acids = list(amino_acid_counts.keys())
    counts = list(amino_acid_counts.values())

    # Create bar chart (histogram)
    fig = px.bar(
        x=amino_acids,
        y=counts,
        labels={'x': 'Amino Acid', 'y': 'Frequency'},
        title=f'Amino Acid Composition - PDB: {pdb_id.upper()}',
        color=counts,
        color_continuous_scale='Viridis'
    )

    # Update layout
    fig.update_layout(
        xaxis_title='Amino Acid (3-letter code)',
        yaxis_title='Count',
        showlegend=False,
        height=400,
        hovermode='x'
    )

    # Sort by amino acid name for consistent display
    fig.update_xaxes(categoryorder='category ascending')

    return fig
Once again, since we have added two new outputs to our callback function, we will also need to update the return statements in the callback function to include the new outputs for the histogram figure and style. For example, if we don’t receive a valid PDB ID, we will return:
if not pdb_id:
    return (
        html.Div("Please enter a valid PDB ID.", className="text-center text-muted mt-5"),
        html.Div("Header information will appear here.", className="text-center text-muted mt-5"),
        {},
        {'display': 'none'},
        dbc.Alert("Please enter a PDB ID.", color="warning")
    )
Or, if there is an error loading the molecule, we will return:
except Exception as e:
    error_msg = dbc.Alert(
        f"Error loading PDB {pdb_id.upper()}: {str(e)}",
        color="danger"
    )
    empty_viewer = html.Div(
        "Failed to load molecule. Please check the PDB ID and try again.",
        className="text-center text-muted mt-5"
    )
    empty_header = html.Div(
        "Header information will appear here.",
        className="text-center text-muted mt-5"
    )
    return empty_viewer, empty_header, {}, {'display': 'none'}, error_msg
And, finally, if the molecule loads successfully, we will return:
if not histogram:
        return viewer, header_display, histogram, {'display': 'none'}, status
    else:
        return viewer, header_display, histogram, {'display': 'block'}, status
Running the Updated App
Once again, putting all of these updates together, our updated app.py file should look like this:
Code
  1import os
  2from collections import Counter
  3
  4import dash_bio as dashbio
  5import dash_bootstrap_components as dbc
  6import plotly.express as px
  7from Bio.PDB import PDBList, PDBParser, parse_pdb_header
  8from dash import Dash, Input, Output, State, callback, dcc, html
  9from dash_bio.utils import PdbParser as DashPdbParser
 10from dash_bio.utils import create_mol3d_style
 11
 12# Initialize the Dash app
 13external_stylesheets = [dbc.themes.CERULEAN]
 14app = Dash(__name__, external_stylesheets=external_stylesheets)
 15
 16# App layout
 17app.layout = dbc.Container([
 18    dbc.Row([
 19        html.Div("Molecular Structure Viewer", className="text-primary text-center fs-3 mb-4")
 20    ]),
 21
 22    dbc.Row([
 23        dbc.Col([
 24            dbc.Label("Enter PDB ID:", className="fw-bold"),
 25            dbc.Input(
 26                id='pdb-input',
 27                type='text',
 28                placeholder='e.g., 4HHB, 3AID, 2MRU, 4K8X',
 29                value='4HHB',
 30                className="mb-2"
 31            ),
 32            dbc.Button("Load Structure", id='load-button', color="primary"),
 33            html.Div(id='status-message', className="mt-3")
 34        ], width=2),
 35
 36        dbc.Col([
 37            html.Div(id='molecule-viewer', children=[
 38                html.Div("Enter a PDB ID and click 'Load Structure' to view the molecule.",
 39                        className="text-center text-muted mt-5")
 40            ])
 41        ], width=5),
 42
 43        dbc.Col([
 44            html.Div(id='header-info', children=[
 45                html.Div("Header information will appear here.",
 46                        className="text-center text-muted mt-5")
 47            ], style={'maxHeight': '600px', 'overflowY': 'auto'})
 48        ], width=5)
 49    ], className="mt-4"),
 50
 51    dbc.Row([
 52        dbc.Col([
 53            dcc.Graph(id='amino-acid-histogram', figure={}, style={'display': 'none'})
 54        ], width=12)
 55    ], className="mt-4"),
 56], fluid=True)
 57
 58# Callback to load and display molecule
 59@callback(
 60    [Output('molecule-viewer', 'children'),
 61    Output('header-info', 'children'),
 62    Output('amino-acid-histogram', 'figure'),
 63    Output('amino-acid-histogram', 'style'),
 64    Output('status-message', 'children')],
 65    Input('load-button', 'n_clicks'),
 66    State('pdb-input', 'value'),
 67    prevent_initial_call=True
 68)
 69def load_molecule(load_clicks, pdb_id):
 70
 71    if not pdb_id:
 72        return (
 73            html.Div("Please enter a valid PDB ID.", className="text-center text-muted mt-5"),
 74            html.Div("Header information will appear here.", className="text-center text-muted mt-5"),
 75            {},
 76            {'display': 'none'},
 77            dbc.Alert("Please enter a PDB ID.", color="warning")
 78        )
 79
 80    try:
 81        # Clean up PDB ID (remove whitespace, convert to lowercase)
 82        pdb_id = pdb_id.strip().lower()
 83
 84        # Create PDB directory if it doesn't exist
 85        pdb_dir = './pdb_files'
 86        os.makedirs(pdb_dir, exist_ok=True)
 87
 88        # Download PDB file using BioPython
 89        pdbl = PDBList()
 90        pdb_file = pdbl.retrieve_pdb_file(pdb_id, pdir=pdb_dir, file_format='pdb')
 91
 92        # Read PDB file content for visualization
 93        dash_parser = DashPdbParser(pdb_file)
 94        pdb_data = dash_parser.mol3d_data()  # Get data in format suitable for Molecule3dViewer
 95        # create styles for visualization needed by Molecule3dViewer
 96        # atoms is a list of dictionaries obtained from parsing the PDB file with DashPdbParser
 97        # visualization_type can be 'cartoon', 'stick', 'sphere'
 98        # color_element can be 'residue', 'chain', 'element', 'partialCharge'
 99        styles = create_mol3d_style(
100            pdb_data['atoms'], visualization_type='cartoon', color_element='residue'
101        )
102
103        # Parse PDB structure for amino acid analysis
104        bio_parser = PDBParser(QUIET=True)
105        structure = bio_parser.get_structure(pdb_id, pdb_file)
106        amino_acid_counts = count_amino_acids(structure)
107
108        # Parse PDB header information
109        header_info = parse_pdb_header(pdb_file)
110
111        # Create Molecule3dViewer component
112        viewer = create_molecule_viewer(pdb_data, styles)
113
114        # Create header display
115        header_display = create_header_display(header_info, pdb_id)
116
117        # Create amino acid histogram
118        histogram = create_amino_acid_histogram(amino_acid_counts, pdb_id)
119
120        status = dbc.Alert(
121            f"Successfully loaded PDB ID: {pdb_id.upper()}",
122            color="success"
123        )
124
125        if not histogram:
126            return viewer, header_display, histogram, {'display': 'none'}, status
127        else:
128            return viewer, header_display, histogram, {'display': 'block'}, status
129
130    except Exception as e:
131        error_msg = dbc.Alert(
132            f"Error loading PDB {pdb_id.upper()}: {str(e)}",
133            color="danger"
134        )
135        empty_viewer = html.Div(
136            "Failed to load molecule. Please check the PDB ID and try again.",
137            className="text-center text-muted mt-5"
138        )
139        empty_header = html.Div(
140            "Header information will appear here.",
141            className="text-center text-muted mt-5"
142        )
143        return empty_viewer, empty_header, {}, {'display': 'none'}, error_msg
144
145def create_molecule_viewer(pdb_data, styles):
146    """Create a Molecule3dViewer from PDB data"""
147    return dashbio.Molecule3dViewer(
148        id='molecule-3d',
149        modelData=pdb_data,
150        styles=styles,
151        selectionType='atom',
152        backgroundColor='#F0F0F0',
153        height=600,
154        width='100%'
155    )
156
157def create_header_display(header_info, pdb_id):
158    """Create a formatted display of PDB header information"""
159    header_sections = []
160
161    # Title
162    if 'name' in header_info:
163        header_sections.append(
164            html.Div([
165                html.H6("Name", className="fw-bold mt-3 mb-2"),
166                html.P(header_info['name'], className="text-sm")
167            ])
168        )
169
170    # Structure Classification
171    if 'structure_method' in header_info:
172        header_sections.append(
173            html.Div([
174                html.H6("Method", className="fw-bold mt-3 mb-2"),
175                html.P(header_info['structure_method'], className="text-sm")
176            ])
177        )
178
179    # Release Date
180    if 'release_date' in header_info:
181        header_sections.append(
182            html.Div([
183                html.H6("Release Date", className="fw-bold mt-3 mb-2"),
184                html.P(header_info['release_date'], className="text-sm")
185            ])
186        )
187
188    # Deposition Date
189    if 'deposition_date' in header_info:
190        header_sections.append(
191            html.Div([
192                html.H6("Deposition Date", className="fw-bold mt-3 mb-2"),
193                html.P(header_info['deposition_date'], className="text-sm")
194            ])
195        )
196
197    # Resolution
198    if 'resolution' in header_info and header_info['resolution'] is not None:
199        header_sections.append(
200            html.Div([
201                html.H6("Resolution (Å)", className="fw-bold mt-3 mb-2"),
202                html.P(f"{header_info['resolution']:.2f}", className="text-sm")
203            ])
204        )
205
206    if 'journal_reference' in header_info and header_info['journal_reference']:
207        journal_text = header_info['journal_reference']
208        header_sections.append(
209            html.Div([
210                html.H6("Journal Reference", className="fw-bold mt-3 mb-2"),
211                html.P(journal_text, className="text-sm", style={'wordWrap': 'break-word'})
212            ])
213        )
214
215    # Keywords
216    if 'keywords' in header_info and header_info['keywords']:
217        keywords_text = header_info['keywords']
218        header_sections.append(
219            html.Div([
220                html.H6("Keywords", className="fw-bold mt-3 mb-2"),
221                html.P(keywords_text, className="text-sm", style={'wordWrap': 'break-word'})
222            ])
223        )
224
225    if header_sections:
226        return dbc.Card([
227            dbc.CardBody([
228                html.H5(f"PDB: {pdb_id.upper()}", className="card-title"),
229                html.Hr(),
230                *header_sections
231            ])
232        ], style={'height': '100%'})
233    else:
234        return html.Div("No header information available.", className="text-center text-muted mt-5")
235
236def count_amino_acids(structure):
237    """Count amino acid frequencies in a PDB structure"""
238    # Standard amino acids (3-letter codes)
239    standard_aa = {
240        'ALA', 'CYS', 'ASP', 'GLU', 'PHE', 'GLY', 'HIS', 'ILE', 'LYS', 'LEU',
241        'MET', 'ASN', 'PRO', 'GLN', 'ARG', 'SER', 'THR', 'VAL', 'TRP', 'TYR'
242    }
243
244    amino_acids = []
245
246    # Iterate through all residues in all chains
247    for model in structure:
248        for chain in model:
249            for residue in chain:
250                # Get residue name and check if it's a standard amino acid
251                res_name = residue.get_resname().strip()
252                if res_name in standard_aa:
253                    amino_acids.append(res_name)
254
255    # Count frequencies
256    return Counter(amino_acids)
257
258def create_amino_acid_histogram(amino_acid_counts, pdb_id):
259    """Create a Plotly histogram of amino acid frequencies"""
260    if not amino_acid_counts:
261        return {}
262
263    # Convert to lists for plotting
264    amino_acids = list(amino_acid_counts.keys())
265    counts = list(amino_acid_counts.values())
266
267    # Create bar chart (histogram)
268    fig = px.bar(
269        x=amino_acids,
270        y=counts,
271        labels={'x': 'Amino Acid', 'y': 'Frequency'},
272        title=f'Amino Acid Composition - PDB: {pdb_id.upper()}',
273        color=counts,
274        color_continuous_scale='Viridis'
275    )
276
277    # Update layout
278    fig.update_layout(
279        xaxis_title='Amino Acid (3-letter code)',
280        yaxis_title='Count',
281        showlegend=False,
282        height=400,
283        hovermode='x'
284    )
285
286    # Sort by amino acid name for consistent display
287    fig.update_xaxes(categoryorder='category ascending')
288
289    return fig
290
291# Run the app
292if __name__ == "__main__":
293    app.run(host='0.0.0.0', port=8050, debug=True)
Again, to run the updated app, simply execute the following command in your VS Code terminal (if it’s not already running):
(.venv) [mbs337-vm]$ python app.py
Dash is running on http://0.0.0.0:8050/

* Serving Flask app 'app'
* Debug mode: on
Now we can navigate to http://<IP_ADDRESS>:8050/ in our web browser to see the updated PDB dashboard
with the new amino acid frequency histogram.
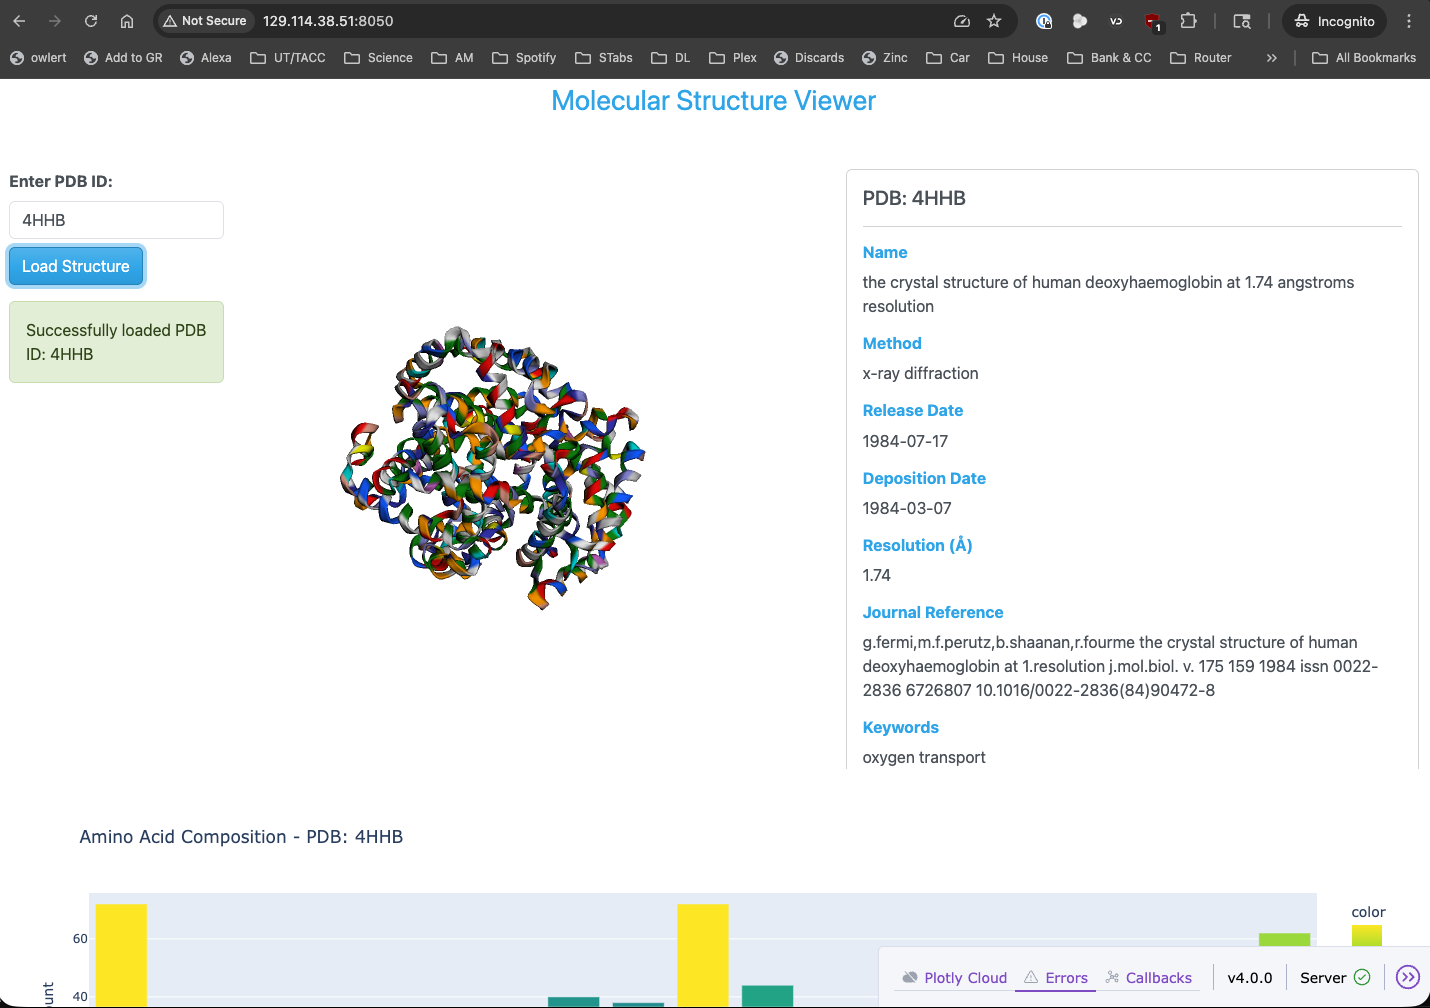
PDB dashboard application with added amino acid frequency histogram running in a web browser.